| Brian Ward |
| San Diego, CA Certified Residential Real Estate Appraiser |
| https://www.brianward.com/San-Diego/Appraiser/San-Diego.html |
| Contact: https://forms.gle/6R2NSosPMkniLG5VA |
|
| SALES INFORMATION: |
| # of Sales 0-3 Months: 53 |
| # of Sales 3-6 Months Ago: 70 |
| Change: -24.3% |
|
| # of Sales 0-6 Months: 123 |
| # of Sales 12-18 Months Ago: 65 |
| Change: 89.2% |
|
| Linear $/Sf Change, 12 Months: 27.3% |
| Linear Sales $ Change, 12 Months: 15.36% |
|
| Linear $/Sf Change, 6 Months: 11.4% |
| Linear Sales $ Change, 6 Months: 27.96% |
|
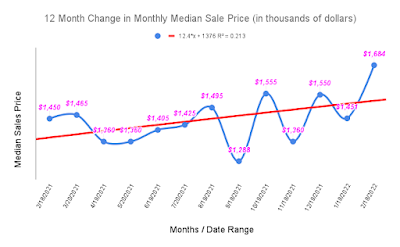
| Median Sale Price 0-3 Months: $1,580,000 |
| Median Sale Price 3-6 Months Ago: $1,365,000 |
| Change: 15.8% |
|
| Median Sale Price 0-6 Months: $1,450,000 |
| Median Sale Price 12-18 Months Ago: $1,230,000 |
| Change: 17.9% |
|
| Median $/Sf 0-3 Months: $604.47 |
| Median $/Sf 3-6 Months Ago: $575.38 |
| Change: 5.1% |
|
| Median $/Sf 0-6 Months: $583.51 |
| Median $/Sf 12-18 Months Ago: $432.60 |
| Change: 34.9% |
|
| Sales Price to List Price Ratio 0-3 Months: 103.0% |
| Sales Price to List Price Ratio 3-6 Mo. Ago: 101.0% |
| Change: 2.0% |
|
| LISTING INFORMATION: |
| Months of Inventory Based on 30 Day's Sales: 0.5 |
| Anticipated Marketing Time: 0-30 days |
|
| # of Listings Past 3 Months: 51 |
| # of Listings 3-6 Months Ago: 64 |
| Change: -20.3% |
|
| Listings Days on Market (0-3 Months): 5 |
| Listings Days on Market (3 to 6 Months Ago): 7 |
| Change: 28.6% |
|
| Median Listing $/Sf (0-3 Months): $624.19 |
| Median Listing $/Sf (3-6 Months Ago): $390.30 |
| Change: 10.6% |
|
| MARKET AREA (PAST 12 MONTHS): |
| Most Common Living Area Range (Sf): 1,783 to 3,877 |
| Most Common Property Year Built: 1982 to 2005 |
|
| # of Stories |
| 1 Story / 16.3% |
| 2 Story / 80.9% |
| 3 Story / 1.1% |
| Split Level / 1.8% |