Showing posts with label 92131. Show all posts

Wednesday, February 23, 2022

San Diego, CA 92131 Housing Trends as of 02/18/2022

Brian Ward
San Diego, CA Certified Residential Real Estate Appraiser
https://www.brianward.com/San-Diego/Appraiser/San-Diego.html
Contact: https://forms.gle/6R2NSosPMkniLG5VA
SALES INFORMATION:
# of Sales 0-3 Months: 53
# of Sales 3-6 Months Ago: 70
Change: -24.3%
# of Sales 0-6 Months: 123
# of Sales 12-18 Months Ago: 65
Change: 89.2%
Linear $/Sf Change, 12 Months: 27.3%
Linear Sales $ Change, 12 Months: 15.36%
Linear $/Sf Change, 6 Months: 11.4%
Linear Sales $ Change, 6 Months: 27.96%
Median Sale Price 0-3 Months: $1,580,000
Median Sale Price 3-6 Months Ago: $1,365,000
Change: 15.8%
Median Sale Price 0-6 Months: $1,450,000
Median Sale Price 12-18 Months Ago: $1,230,000
Change: 17.9%
Median $/Sf 0-3 Months: $604.47
Median $/Sf 3-6 Months Ago: $575.38
Change: 5.1%
Median $/Sf 0-6 Months: $583.51
Median $/Sf 12-18 Months Ago: $432.60
Change: 34.9%
Sales Price to List Price Ratio 0-3 Months: 103.0%
Sales Price to List Price Ratio 3-6 Mo. Ago: 101.0%
Change: 2.0%
LISTING INFORMATION:
Months of Inventory Based on 30 Day's Sales: 0.5
Anticipated Marketing Time: 0-30 days
# of Listings Past 3 Months: 51
# of Listings 3-6 Months Ago: 64
Change: -20.3%
Listings Days on Market (0-3 Months): 5
Listings Days on Market (3 to 6 Months Ago): 7
Change: 28.6%
Median Listing $/Sf (0-3 Months): $624.19
Median Listing $/Sf (3-6 Months Ago): $390.30
Change: 10.6%
MARKET AREA (PAST 12 MONTHS):
Most Common Living Area Range (Sf): 1,783 to 3,877
Most Common Property Year Built: 1982 to 2005
# of Stories
1 Story / 16.3%
2 Story / 80.9%
3 Story / 1.1%
Split Level / 1.8%

Thursday, September 13, 2018

San Diego, CA 92131 Housing Market Trends as of 09/10/2018


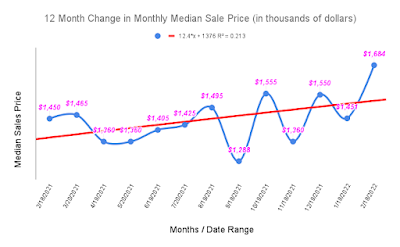
Over the course of the 12 months ending on 9/10/2018, and in San Diego, CA 92131, the total number of sales increased 33%, the total number of active listings increased 175%, the months of housing supply increased 108% to 1.9 months, the median sale price remained stable and changed 1.0%, the typical market exposure time increased 21.4% to 17 days, the median list price remained stable and changed 0.9%, the typical listings days on market increased 128.6% to 32 days , and the median sale price as a percentage of list price remained stable and changed 0.3%. 

When comparing the most recent 3 month period with the previous 3 month period the total number of sales increased 28%, the total number of active listings increased 33%, the months of housing supply decreased 22% to 1.9 months, the median sale price decreased 2.1%, the typical market exposure time increased 71.4% to 17 days, the median list price remained stable and changed 1.3%, the typical listings days on market increased 78.6% to 32 days , and the median sale price as a percentage of list price remained stable and changed 0.4%.

Brian A. Ward
CA Certified Appraiser

Real Estate Appraisal Services For:
* Estates
* Trusts
* Expert Witness Testimony
* Before Buying and/or Obtaining a Mortgage (critical)
* Before Selling
* Property Tax Appeals
* Intra-Family Home Purchases and Sales
* Bonds, Such as Bail Bonds
* More!

Wednesday, July 24, 2013

San Diego, CA 92131 Property Values are Increasing. By How Much?


NEIGHBORHOOD/MARKET AREA DESCRIPTION
In San Diego, CA 92131, there is a mix of property types present with most being residential, schools, parks, or commercial.  While a wider range of living areas are present, most single family residences range in living area size from 1,811 Sqft to 3,856 Sqft, with the most common being approximately 2,500 Sqft.  Most properties (74%) have 4 or 5 bedrooms, and most properties (60%) have 2.5 or 3 bathrooms.  Most single family residences range in year built from 1983 to 2005 with the most common year built being 2000.  Views are present in the neighborhood and Realtors report that 53% of all single family residences have them.  The views include: bay, city, evening lights, greenbelt, lagoon/estuary, lake/river, mountain/hills, ocean, and panoramic.  Public and private services, conveniences, and employment are typical of population centers throughout the county.

MARKET CONDITIONS
In San Diego, CA 92131, and as of the 12 month period ending 07/17/2013, single family residence sale prices ranged from $360,000 to $1,560,000, with a median of $700,000.  The median sale price changed 9.4% over the past year indicating an 'increasing' property values trend.  The median $/Sqft changed 15.5% over the past year indicating an 'increasing' property values trend.  There are currently 2.4 months of housing inventory indicating a demand/supply trend of 'in balance'.  The median market exposure time over the past 30 days was 9 days.  Based on recent-past market exposure times, I anticipate that the typical/median marketing time will be under 3 months over the coming 90 days.  Property value trends may be misleading due to a decreasing ratio of bank sales and short sales, and an increase in the ratio of renovated properties.

10 Year San Diego, CA Home Price Trend According to Zillow.com

Brian A. Ward
San Diego, CA 92131 Real Estate Appraiser
(619) 630-9273