| Listing Information: |
| Months of Inventory Based on 30 Day's Sales: 0.3 |
| Anticipated Marketing Time: 0-30 days |
|
| # of Listings Past 3 Months: 85 |
| # of Listings 3-6 Months Ago: 142 |
| Change: -40.1% |
|
| Listings Days on Market (Past 3 Months): 6 |
| Listings Days on Market (3 to 6 Months Ago): 7 |
| Change: -14.3% |
|
| Median Listing $/Sf (Past 3 Months): $598.70 |
| Median Listing $/Sf (3-6 Months Ago): $390.30 |
| Change: 10.4% |
|
| Market Area (Past 12 Months): |
| Most Common Living Area Range (Sf): 981 to 3,491 |
| Most Common Property Year Built: 1965 to 1995 |
|
| Subject Living Area (Sf): 1,520 |
| Smaller Homes: 164 / 27.6% |
| Larger Homes: 431 / 72.4% |
|
| Subject Property Year Built: 1966 |
| Homes Older than the Subject: 103 / 17.4% |
| Homes Newer than the Subject: 490 / 82.6% |
|
| Subject Property's Site Size (Sf): 9,700 |
| Sales with Smaller Sites: 37.8% |
| Sales with Larger Sites: 62.2% |
|
| # of Stories |
| 1 Story / 67.8% |
| 2 Story / 30.2% |
| 3 Story / 0.3% |
| Other/Remarks / 0.2% |
| Split Level / 1.5% |
|
| Sales Information: |
| # of Sales Past 3 Months: 105 |
| # of Sales 3-6 Months Ago: 139 |
| Change: -24.5% |
|
| # of Sales Past 6 Months: 254 |
| # of Sales 12-18 Months Ago: 141 |
| Change: 80.1% |
|
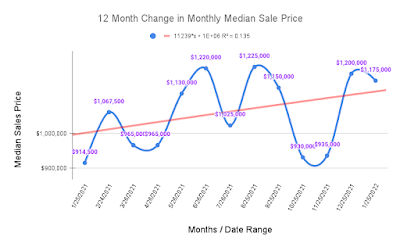
| Median Sale Price Past 3 Months: $1,035,000 |
| Median Sale Price 3-6 Months Ago: $1,116,000 |
| Change: -7.3% |
|
| Median Sale Price Past 6 Months: $1,075,500 |
| Median Sale Price 12-18 Months Ago: $861,000 |
| Change: 24.9% |
|
| Median $/Sf Past 3 Months: $577.43 |
| Median $/Sf 3-6 Months Ago: $533.98 |
| Change: 8.1% |
|
| Median $/Sf Past 6 Months: $545.72 |
| Median $/Sf 12-18 Months Ago: $433.50 |
| Change: 25.9% |
|
| Sales Price to List Price Ratio Past 3 Months: 100.0% |
| Sales Price to List Price Ratio 3-6 Mo. Ago: 101.0% |
| Change: -1.0% |

